RNA sequencing (RNA-Seq) is a powerful technique that helps researchers study gene expression, giving them a window into what’s happening inside cells at a molecular level. However, analyzing RNA-Seq data can be challenging due to the large amount of data involved, particularly when trying to figure out which genes are expressed differently under certain conditions. Researchers at the University of British Columbia have developed the R package PathlinkR. It helps streamline this process, making it easier for scientists to understand the results.
What Is PathlinkR?
PathlinkR is a tool designed to help researchers analyze RNA-Seq data by focusing on genes that are expressed differently between two groups, like healthy versus diseased tissues. It simplifies the process of identifying important biological pathways—these are networks of interacting genes and proteins that control vital cellular functions.
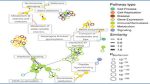
A selection of figures summarizing results generated by pathlinkR
A: Volcano plot created by “eruption” showing the fold changes and significance of DEGs, automatically labelling the top genes. B: A zero order PPI network created with pathlinkR using PPI data from InnateDB, with the node colour indicating fold change direction, and key hub nodes highlighted with blue or black labels.. C: Plotting the results of “pathwayEnrichment” for immune pathways, with triangles to indicate the presence and directionality of pathways for each condition on the x axis, and pathways sorted alphabetically on the y-axis. An asterisk indicates a pathway was significant in both directions; only one triangle is depicted, corresponding to the direction with the lower p value. D: A network constructed from pathway enrichment results, with nodes representing single pathways, and edges drawn for pathways with similarity above a specified threshold.
How Does It Work?
PathlinkR does two main things:
Pathway Enrichment Analysis: This step looks at whether certain biological pathways are more active or suppressed in the data. For example, if many of the differentially expressed genes are involved in a specific signaling pathway, it could indicate that this pathway is playing a role in a disease or condition being studied.
Network-Based Analysis: This looks at how genes are connected to each other in biological networks. By examining how different genes interact, researchers can understand the broader biological context of their data.
Why Is PathlinkR Important?
PathlinkR saves researchers time by automating much of the complex analysis needed to make sense of RNA-Seq data. It also produces high-quality visual figures that summarize the results, making it easier to spot trends and communicate findings. These publication-ready figures are crucial for sharing results in scientific papers and presentations.
In short, PathlinkR helps researchers take raw RNA-Seq data and turn it into meaningful insights about gene activity, which can then be used to explore new therapies, understand diseases better, or investigate how cells function. By simplifying the analysis of large datasets, PathlinkR is helping scientists move from data to discovery more efficiently than ever before.
Availability – pathlinkR is available to install from the software repository Bioconductor at https://bioconductor.org/packages/pathlinkR/.