Alzheimer’s disease (AD) has long been linked to changes in the brain, but the exact cellular dynamics leading to its onset have remained unclear. A recent study led by researchers at the Hebrew University of Jerusalem used RNA sequencing (RNA-seq) to map out these changes and gain insights into how Alzheimer’s develops. RNA-seq is a powerful technique that allows scientists to see which genes are active in different cells by analyzing their RNA. In this study, the researchers applied RNA-seq to analyze over 1.65 million individual brain cells from 437 older adults, creating a detailed “cell atlas” of the aging brain.
Crunching data from 1.6 million brain cells
The study was a technical marvel, cleverly combining new molecular technologies, machine-learning techniques, and a large collection of brains donated by aging adults.
Though previous studies of brain samples from Alzheimer’s patients have provided insights into molecules involved in the disease, they have not revealed many details about where in the long sequence of events leading to Alzheimer’s those genes play a role and which cells are involved at each step of the process.
The RNA-seq data revealed two types of microglial cells (a kind of glial cell) that drive key AD processes: one type promotes the buildup of amyloid-β plaques, while the other links amyloid-β to tau tangles, both hallmarks of the disease.
“Past studies have analyzed brain samples as a whole and they lose all cellular detail,” De Jager says. “We now have tools to look at the brain in finer resolution, at the level of individual cells. When we couple this with detailed information on the cognitive state of brain donors before death, we can reconstruct trajectories of brain aging from the earliest stages of the disease.”
The new analysis required over 400 brains, which were provided by the Religious Orders Study and the Memory & Aging Project based at Rush University in Chicago.
Within each brain, the researchers collected several thousand cells from a brain region impacted by Alzheimer’s and aging. Every cell was then run through a process—single-cell RNA sequencing—that gave a readout of the cell’s activity and which of its genes were active.
Data from all 1.6 million cells were then analyzed by algorithms and machine-learning techniques developed by Menon and Habib to identify the types of cells present in the sample and their interactions with other cells.
“These methods allowed us to gain new insights into potential sequences of molecular events that result in altered brain function and cognitive impairment,” Menon says. “This was only possible thanks to the large number of brain donors and cells the team was fortunate enough to generate data from.”
Cellular atlas of the human aged DLPFC in older individuals
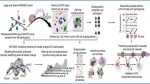
a, Overview of the experimental and analytic steps. b,c, Clinicopathologic characteristics of the 465 ROSMAP participants. b, Participants’ age of death, final cognitive diagnosis and distribution of pathologic hallmarks of AD, Aβ (CERAD score) and tau (Braak score). Additional details are provided in Supplementary Table 1. c, The load of Aβ pathology (x axis) compared to the load of tau pathology (y axis) among participants. Dots and triangles indicate female and male participants, respectively, coloured by their rate of cognitive decline. d, The ageing-DLPFC atlas. UMAP embedding of 1,649,672 single-nucleus RNA profiles from the DLPFC of participants. Major cell types are noted; shades highlight some of the 95 different cell subpopulations. e, The atlas scale. The number of nuclei per cell type in each participant is shown. Dots represent individual participants (n = 465 per cell type). Additional quality-control graphs are shown in Extended Data Fig. 1. Exc., excitatory; inh., inhibitory; oligodend., oligodendrocytes. f, Cellular diversity. The proportions of cell subpopulations across participants are shown. The stacked bar plots show cell subpopulation proportions per participant within each major cell type, colour coded by cell type and shaded by subpopulations. For the box plots in b and e, the box limits show the first and third quartiles, the centre line shows the median value, and the whiskers extend to the highest and lowest values within 1.5× the distance between the quartiles.
Additionally, the study highlighted a type of astrocyte (another glial cell) that influences how tau tangles affect memory loss. To map these cellular changes in more detail, the researchers developed a new model called BEYOND (Brain Environment dYnamics Of NeuroDegeneration). This model tracks how different brain cells change and interact over time, identifying two distinct aging paths: one leading to Alzheimer’s and the other representing normal brain aging.
The BEYOND model adds another layer to the study by showing how coordinated changes in brain cell communities—like neurons, astrocytes, and microglia—drive the progression toward AD. It revealed that Alzheimer’s isn’t just a general effect of aging but follows a unique cellular trajectory. This allows researchers to better understand how different cell populations influence disease progression and provides a clearer target for personalized treatments that could slow or even halt Alzheimer’s.
In summary, RNA sequencing and the BEYOND model together provided the key to unlocking the complex cellular landscape of the aging brain, helping researchers pinpoint which cells and genetic pathways are involved in the progression of Alzheimer’s. This breakthrough gives us new hope for developing more effective treatments for those at risk.
Availability – The complete code base used in this study is available at GitHub (https://github.com/naomihabiblab/BEYOND_DLPFC)
Source – Columbia University