Imagine trying to map out the complex details of a city, understanding not just the layout of the streets but also how each building is used and who lives there. Now, imagine doing the same thing, but for tissues in the human body. This is what scientists aim to do with tools called single cell and spatial transcriptomics. These tools help researchers understand how individual cells in a tissue function and where they are located within that tissue. However, integrating and sharing the vast amount of data these tools generate has been a significant challenge—until now.
The Challenge of Integrating Single Cell and Spatial Transcriptomics
Single cell RNA-sequencing (scRNA-seq) and spatial transcriptomics (ST) are powerful techniques that offer complementary insights into tissues. scRNA-seq allows scientists to analyze the gene expression of individual cells, giving a detailed picture of what each cell is doing. However, it doesn’t tell us where exactly these cells are located within the tissue. On the other hand, spatial transcriptomics can map gene expression within the tissue, but it often lacks the resolution to identify individual cells.
To truly understand how tissues function, scientists need to combine these two approaches, integrating the detailed cellular information from scRNA-seq with the spatial context provided by ST. However, this integration creates massive datasets that are difficult to share and explore, especially online. Existing software tools struggle to handle the scale and complexity of these combined datasets, limiting the ability of researchers to fully utilize the data.
Introducing WebAtlas: A Solution for Data Integration and Exploration
To overcome these challenges, researchers at the Wellcome Sanger Institute have developed a new tool called WebAtlas. WebAtlas is a user-friendly platform that allows scientists to share and explore integrated single cell and spatial transcriptomic datasets interactively online.
WebAtlas unifies data from different atlassing technologies into a cloud-optimized format called Zarr, which is designed for large-scale data. It then uses a visualization tool called Vitessce to allow researchers to navigate and explore the data remotely, without needing to download massive files or have specialized software on their computers.
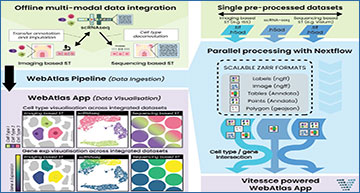
Overview of WebAtlas pipeline
A. WebAtlas incorporates integrated scRNA-seq, imaging- and sequencing-based ST datasets for interactive web visualisation, enabling cross-query of cell types and gene expressions across modalities. B. WebAtlas data ingestion pipeline converts diverse data objects from integrated single cell and spatial technologies to the Zarr format and runs on Nextflow. The pipeline extracts shared genes and cell types features across modalities.
How WebAtlas Works
The beauty of WebAtlas lies in its ability to integrate and visualize complex data in a way that’s accessible to everyone. For example, if a researcher is studying the development of the human lower limb, they can use WebAtlas to cross-reference cell types and gene expression data across both single cell and spatial transcriptomic datasets. This means they can see not only which genes are active in specific cells but also where these cells are located within the developing tissue.
Why WebAtlas is Important
WebAtlas represents a significant step forward in tissue research. By making it easier to share and explore integrated datasets, it opens up new possibilities for scientific discovery. Researchers can now gain deeper insights into how tissues develop, function, and respond to disease by accessing and analyzing data that was previously too complex or cumbersome to use effectively.
WebAtlas is a groundbreaking tool that brings together the strengths of single cell and spatial transcriptomics, enabling researchers to explore tissues in a way that was not possible before. This innovation not only enhances our understanding of biology but also accelerates the pace of research, potentially leading to new discoveries in how tissues develop and how diseases progress.
Availability – Comprehensive documentation, tutorials and sample workflows are available at https://haniffalab.github.io/webatlas-pipeline.
