Differential expression gene analysis results
Prior to the commencement of the biological information analysis, the batch effects of the collected datasets were evaluated. It was observed that the batch effects of the two diseases, atopic dermatitis and type 2 diabetes, were significant (Fig. 2A, D). To address this, the ComBat function from the “sva” package was employed to remove batch effects from the samples, resulting in reliable analysis results (Fig. 2B for atopic dermatitis and Fig. 2E for type 2 diabetes). Subsequently, the limma package was utilized to perform a DEGs analysis on the transcriptome data. In the analysis of data related to atopic dermatitis, a total of 1942 DEGs were identified with a threshold parameter set at |LogFC|>0.5 and p Value < 0.05. Among these, 1002 genes were up-regulated and 940 genes were down-regulated in the disease group. For the blood transcriptome data of type 2 diabetes, 369 DEGs were identified with the threshold parameter set at |LogFC|>0.3 and p Value < 0.05. Of these, 239 genes were up-regulated and 130 genes were down-regulated. The results of all DEGs are visualized using volcano plots (Fig. 2C, F) and heatmaps (Fig. 2G, H).
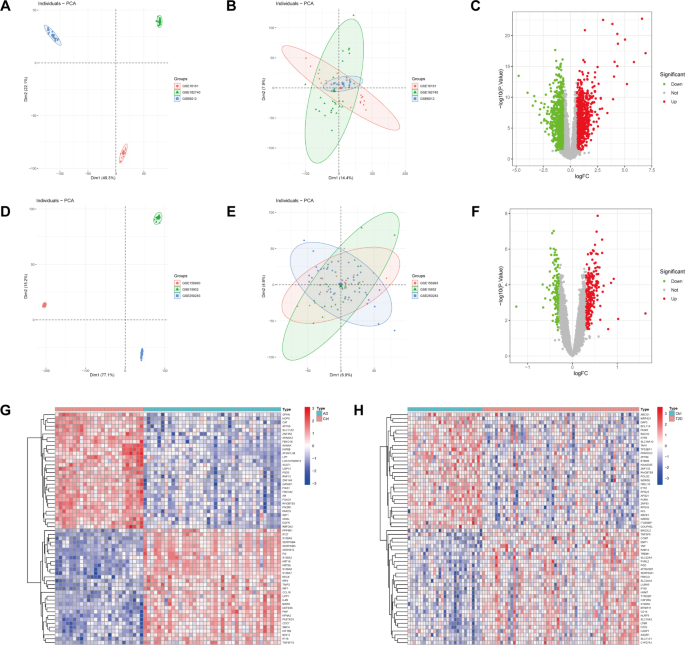
Evaluation and removal of batch effects in datasets for atopic dermatitis and type 2 diabetes. (A, D) Initial assessment of batch effects showing significant discrepancies. (B, E) Results after applying the method to remove batch effects. (C, F) Volcano plots displaying the results of the DEGs analysis using the limma package, with thresholds set at |LogFC|>0.5 and p Value < 0.05 for atopic dermatitis, and |LogFC| > 0.3 and p Value < 0.05 for type 2 diabetes. (G, H) Heatmaps visualizing the identified DEGs.
GSVA analysis of atopic dermatitis and diabetes comorbidity
To evaluate the differences in enriched signaling pathways between two diseases, we performed GSVA analysis on the transcriptome data of these two diseases separately. In the skin tissue of atopic dermatitis compared to normal tissue, Toll-like receptor and NFκB signaling pathways; TNF and NFκB signaling pathways and PI3K signaling pathways are significantly up-regulated (Fig. 3A). Similarly, we also found significant up-regulation of these pathways in the transcriptome of blood samples from type 2 diabetes (Fig. 3B). Toll-like receptors (TLRs) and tumor necrosis factor (TNF) and nuclear factor κB (NFκB) signaling pathways play a crucial role in regulating immune and inflammatory responses. In the skin tissue of atopic dermatitis, the up-regulation of these pathways may be related to the interaction of multiple links such as skin barrier function impairment, microbiota imbalance, and immune regulation abnormalities. In type 2 diabetes, the up-regulation of these pathways may be related to pancreatic β-cell dysfunction, insulin resistance, and systemic inflammation. In addition, phosphatidylinositol 3-kinase (PI3K) signaling pathway plays a role in regulating cell growth, metabolism, and survival, and its up-regulation in these two diseases suggests an increase in metabolic abnormalities and cellular stress responses. These findings reveal possible common pathogenic mechanisms at the molecular level in AD and T2DM.
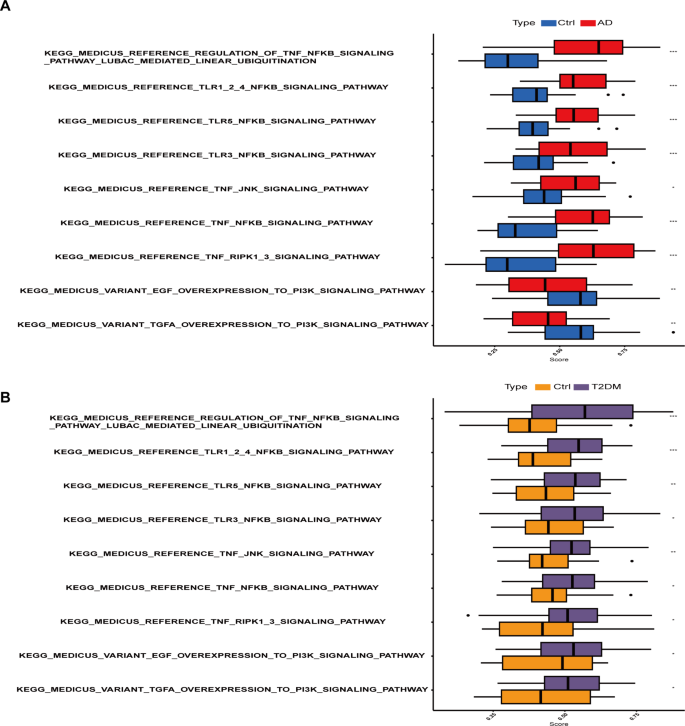
GSVA analysis of transcriptome data reveals significant up-regulation of Toll-like receptor, TNF, NFκB, and PI3K signaling pathways in both atopic dermatitis (A) and type 2 diabetes (B) compared to normal tissue.
Results of function and pathway enrichment analysis
In our research, we conducted an in-depth investigation into the biological functions and signaling pathways of differentially expressed genes in atopic dermatitis and type 2 diabetes. We performed GO and KEGG enrichment analyses on the gene sets that were commonly upregulated and downregulated in these two diseases. We found that 31 genes (Fig. 4A) were commonly upregulated and 10 genes (Fig. 4B) were commonly downregulated in both diseases. The commonly upregulated genes primarily participate in the production and regulation of TNF factors, which are crucial biological functions (Fig. 4C). Subcellularly, these genes are mainly located in secretory granule lumen and cytoplasmic vesicle lumen. In terms of molecular biological function, these genes mainly participate in monosaccharide binding. TNF factors are cytokines that play a significant role in inflammatory and immune responses. In atopic dermatitis, overproduction of TNF factors may lead to skin inflammation, thereby triggering dermatitis symptoms. In type 2 diabetes, TNF factors are also considered to be a critical factor causing insulin resistance. On the other hand, the genes that are commonly downregulated in both diseases mainly participate in the transport of aromatic amino acids, a key biological function (Fig. 4D). Subcellularly, these genes are mainly located on the basolateral plasma membrane. In terms of molecular biological function, these genes mainly exhibit aromatic amino acid transmembrane transporter activity. Aromatic amino acids are a class of essential amino acids that are crucial for protein synthesis and normal body function. In atopic dermatitis, the transport of aromatic amino acids may affect the metabolism and function of skin cells, thereby influencing the development of dermatitis. In type 2 diabetes, the transport of aromatic amino acids may also affect the synthesis and secretion of insulin, thereby affecting the onset of diabetes. Through KEGG enrichment analysis, we found that the upregulated genes mainly participate in the NOD-like receptor signaling pathway, an important immune response pathway (Fig. 4E). The downregulated genes mainly participate in protein digestion and absorption, a basic process for maintaining life activities (Fig. 4F). The NOD-like receptor signaling pathway is an important immune response pathway, which may be related to the immune response of atopic dermatitis. Protein digestion and absorption is a basic process for maintaining life activities, which may be related to the nutritional metabolism of type 2 diabetes.
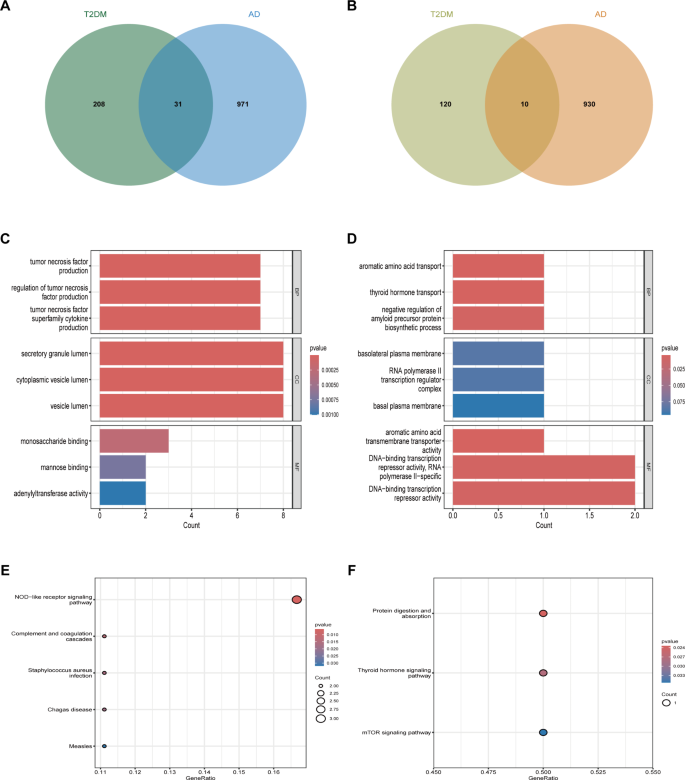
Analysis of differentially expressed genes in atopic dermatitis and type 2 diabetes. (A) Venn diagram showing 31 commonly upregulated genes. (B) Venn diagram showing 10 commonly downregulated genes. (C) GO enrichment analysis of commonly upregulated genes. (D) GO enrichment analysis of commonly downregulated genes. (E) Enriched pathways for upregulated genes in atopic dermatitis, including the NOD-like receptor signaling pathway (hsa04621), based on KEGG analysis17. (F) Enriched pathways for downregulated genes in type 2 diabetes, including the Protein digestion and absorption pathway (hsa04974), analyzed using KEGG18 .
Identify potential shared diagnostic genes based on machine learning algorithms
In order to further identify feature genes with significant classification power between disease and control groups, we conducted two distinct algorithmic analyses, namely SVM-REF and Random Forest, on 31 upregulated differential genes. Through the SVM algorithm, we identified 28 genes from the 31 upregulated ones that exhibited the lowest 5-fold cross-validation (5×CV) error and the highest 5×CV accuracy (Fig. 5A). Additionally, we evaluated the importance of each gene using the RF algorithm and set a threshold for importance scores greater than 1, ultimately filtering down to 8 genes (Fig. 5B). By intersecting the genes selected by these two algorithms, we obtained 8 feature genes related to atopic dermatitis (Fig. 5C). We applied the same methodology to further analyze the feature genes in type 2 diabetes. In the SVM algorithm, we identified 10 genes with the lowest 5×CV error and the highest 5×CV accuracy (Fig. 5D). By setting a threshold for importance scores greater than 1 in the Random Forest algorithm, we obtained 16 genes (Fig. 5E). By intersecting the genes obtained from the two algorithms, we identified 7 feature genes associated with type 2 diabetes (Fig. 5F).
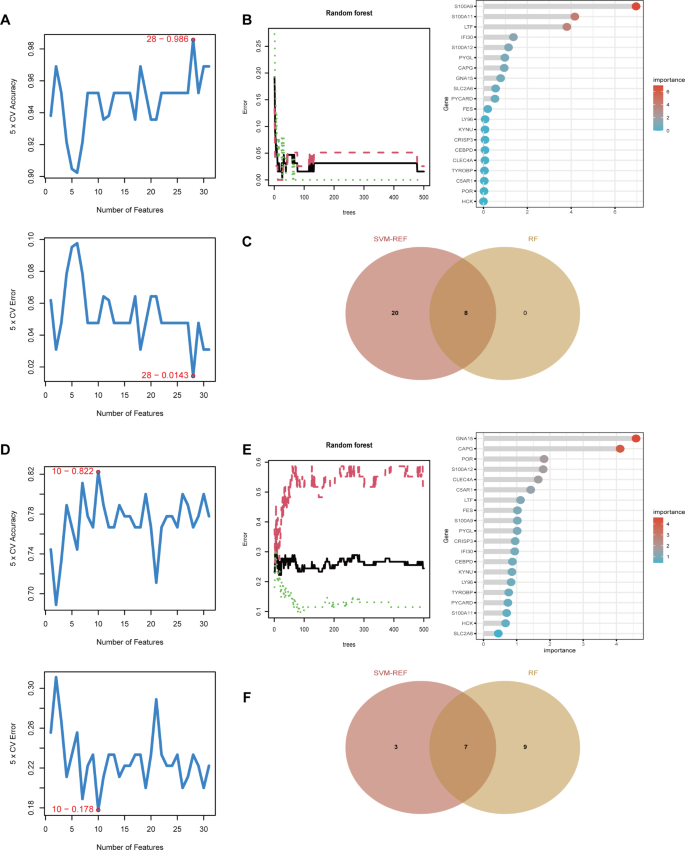
Identification of feature genes with significant classification power between disease and control groups. (A) SVM-REF analysis of 31 upregulated genes in atopic dermatitis, identifying 28 genes with the lowest 5-fold cross-validation error and highest accuracy. (B) Random Forest analysis of 31 upregulated genes in atopic dermatitis, highlighting 8 genes with importance scores greater than 1. (C) Venn diagram showing 8 intersecting feature genes in atopic dermatitis selected by both algorithms. (D) SVM-REF analysis of upregulated genes in type 2 diabetes, identifying 10 genes with the lowest 5-fold cross-validation error and highest accuracy. (E) Random Forest analysis of upregulated genes in type 2 diabetes, highlighting 16 genes with importance scores greater than 1. (F) Venn diagram showing 7 intersecting feature genes in type 2 diabetes selected by both algorithms.
Analysis of the shared genes
In the aforementioned machine learning screening process, a total of 8 disease characteristic genes were obtained for atopic dermatitis, and 7 characteristic genes were obtained for type 2 diabetes. By taking the intersection of the characteristic genes of the two diseases, we found that LTF, LTB4R, and CCR1 genes are common characteristic genes for both diseases (Fig. 6A). In these two diseases, the LTF, LTB4R, and CCR1 genes are significantly up-regulated in disease tissues compared to normal tissues (Fig. 6B, C). The ROC curve was used to evaluate the expression specificity of LTF, LTB4R, and CCR1 genes in atopic dermatitis and type 2 diabetes. In atopic dermatitis, the area under the curve (AUC) was 92.3%, 92.8%, and 66.5% respectively (Fig. 6D), while in type 2 diabetes, the AUC was 71.2%, 67.9%, and 67.7% respectively (Fig. 6E). These results indicate that the LTF, LTB4R, and CCR1 genes are clearly enriched in atopic dermatitis and type 2 diabetes, and may serve as potential biomarkers.
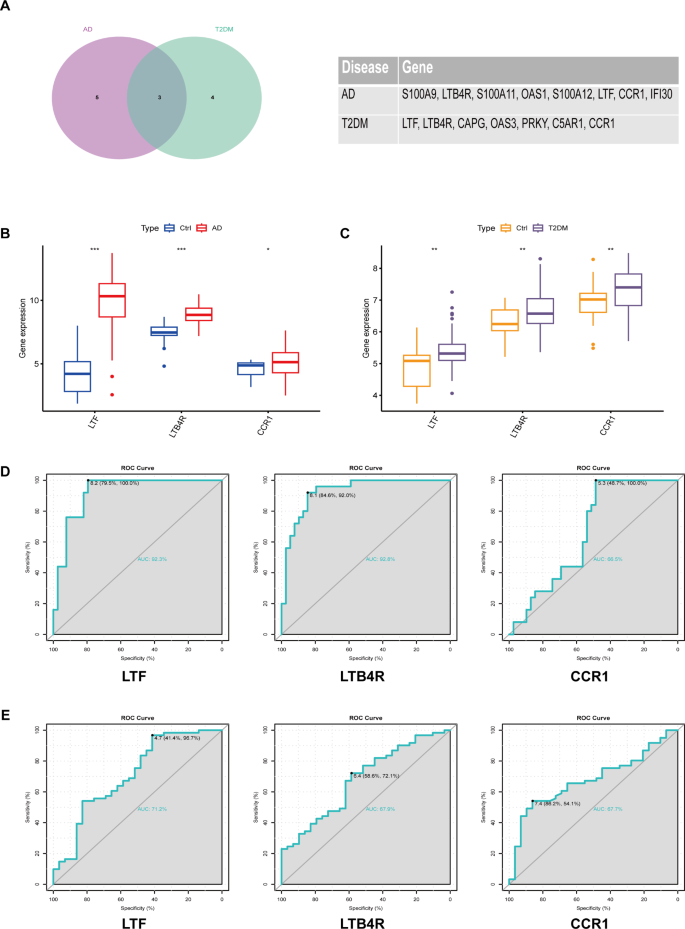
Identification of common characteristic genes and evaluation of their expression specificity in atopic dermatitis and type 2 diabetes. (A) Venn diagram showing common characteristic genes (LTF, LTB4R, and CCR1) identified in both diseases. (B, C) Expression levels of LTF, LTB4R, and CCR1 genes in disease tissues compared to normal tissues. (D) ROC curve analysis showing expression specificity of LTF, LTB4R, and CCR1 genes in atopic dermatitis. (E) ROC curve analysis showing expression specificity of LTF, LTB4R, and CCR1 genes in type 2 diabetes. AUC values indicate the potential of these genes as biomarkers for each disease.
Correlation between shared diagnostic genes and immune cell infiltration
We utilized the CIBORSORT package to conduct an in-depth evaluation of the infiltration levels of 22 types of immune cells in each sample from two diseases. In the tissue samples from atopic dermatitis, we observed a significant increase in the infiltration levels of CD4 + T cells, helper T cells, and γδ T cells (Fig. 7A). Conversely, in the blood samples from type 2 diabetes, there was a significant increase in the infiltration level of monocytes (Fig. 7B). Furthermore, we performed an immune cell infiltration correlation analysis on the common feature genes of the two diseases. The analysis results showed that in atopic dermatitis, the LTF and LTB4R genes were positively correlated with the infiltration levels of dendritic cells, CD4 + T cells, and γδ T cells, and negatively correlated with the infiltration levels of M2 macrophages and mast cells (Fig. 7C). Additionally, the CCR1 gene also showed a positive correlation with the infiltration levels of CD4 T cells and γδ T cells. In type 2 diabetes, we found that the CCR1 gene was significantly positively correlated with the infiltration level of monocytes, and significantly negatively correlated with the infiltration level of CD8 + T cells (Fig. 7D).
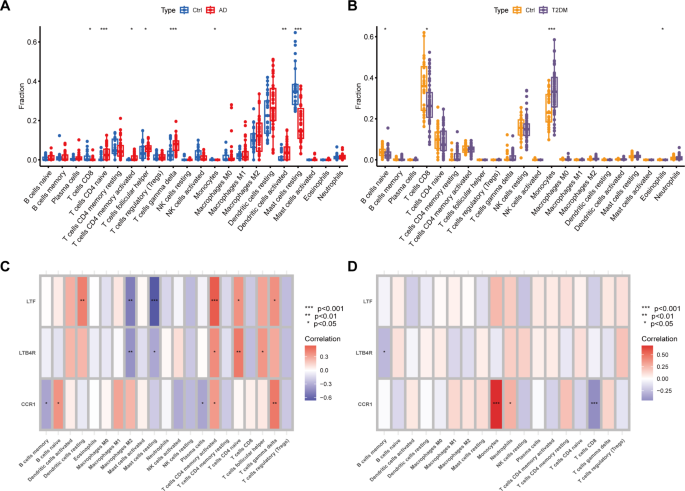
Atopic dermatitis and type 2 diabetes immune cell infiltration analysis. (A) Box plot showing the infiltration levels of immune cells in atopic dermatitis skin tissue. (B) Box plot showing the infiltration levels of immune cells in type 2 diabetes blood samples. (C) Heatmap showing the correlation between common feature genes and immune cell infiltration in atopic dermatitis. (D) Heatmap showing the correlation between common feature genes and immune cell infiltration in type 2 diabetes.
Results of single-cell analysis
In the skin tissue samples of atopic dermatitis, we classified cells into Keratinocytes, Proliferating Keratinocytes, T cells, Proliferating T cells, Fibroblasts, Endothelial cells, Dendritic cells, Smooth muscle cells, Macrophages, and Neuron cells based on the expression of marker genes for each cell group (Fig. 8A, B). Figure 8C illustrates the degree of cellular communication among various cell types in the skin tissue. Additionally, we conducted a visualization analysis of the enrichment degree of common feature genes of the two diseases in various cell types. The results showed that the LTF and LTB4R genes are primarily enriched in Keratinocytes, while the CCR1 gene is mainly expressed in Macrophages in the skin tissue (Fig. 8D). We also performed single-cell analysis on the blood samples of type 2 diabetes and annotated it using SingleR. The results showed that the cells in the blood of type 2 diabetes are mainly divided into B cells, Monocytes, NK cells, and T cells (Fig. 8E). Figure 8F displays the degree of communication between various cell types in the blood samples. Furthermore, we visualized the degree of enrichment of common feature genes of the two diseases in various cell types in the blood tissue. The results showed that the LTF, LTB4R, and CCR1 genes are primarily expressed in Monocytes in the blood (Fig. 8G). We also extracted monocytes from the two diseases and conducted differential gene expression analysis based on the high and low expression of the CCR1 gene. Subsequently, we performed KEGG enrichment analysis on the differentially expressed genes. The results showed that in atopic dermatitis, the differentially expressed genes mainly participate in cytokine signaling pathway, mTOR signaling pathway, NOD-like receptor signaling pathway, and TNF signaling pathway (Fig. 8H). In type 2 diabetes, the differentially expressed genes mainly participate in cytokine-cytokine receptor interaction, cytokine signaling pathway, NFκB signaling pathway, and TNF signaling pathway (Fig. 8I).
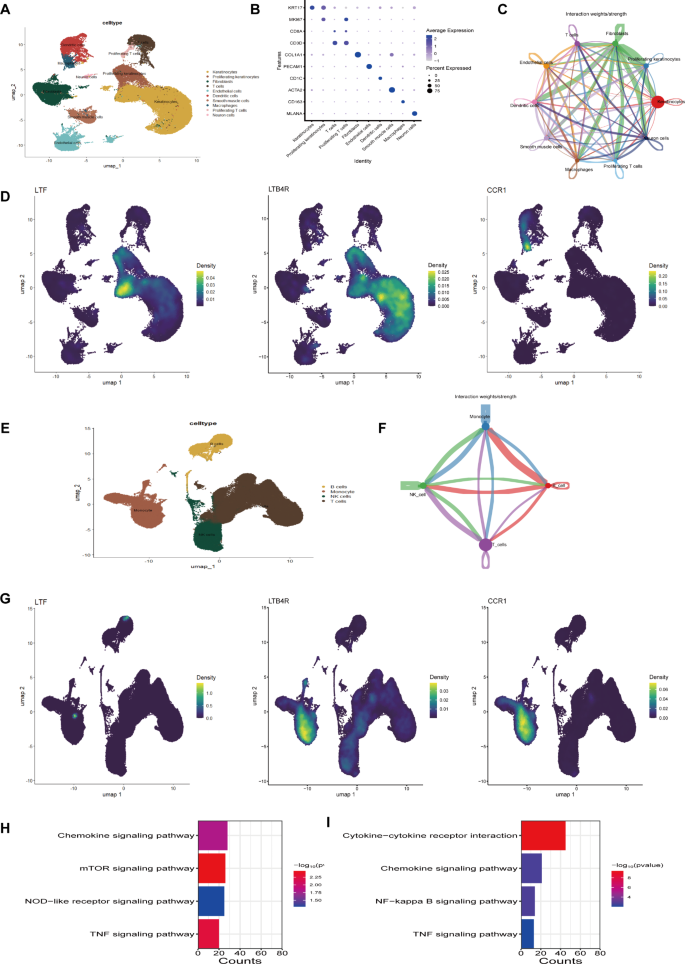
Single-cell analysis and gene enrichment in atopic dermatitis and type 2 diabetes. (A) UMAP plot of cell types in atopic dermatitis skin tissue. (B) Marker gene bubble plot for cell classification in atopic dermatitis. (C) Cellular communication among various cell types in atopic dermatitis. (D) UMAP plot showing the enrichment of common feature genes in different cell types of atopic dermatitis. (E) UMAP plot of cell types in type 2 diabetes blood samples. (F) Cellular communication among various cell types in type 2 diabetes. (G) UMAP plot showing the enrichment of common feature genes in different cell types of type 2 diabetes. (H) KEGG enrichment analysis results showing pathways enriched in monocytes of atopic dermatitis. Top pathways include the NOD-like receptor signaling pathway (hsa04621), mTOR signaling pathway (hsa04150), and TNF signaling pathway (hsa04668). Data was retrieved and analyzed using the KEGG database19. (I) KEGG enrichment analysis results showing pathways enriched in monocytes of type 2 diabetes. Top pathways include Cytokine-cytokine receptor interaction (hsa04060), NFκB signaling pathway (hsa04064), and TNF signaling pathway (hsa04668). Data was retrieved from the KEGG database17,18 .
Identification of candidate compounds for CCR1 target
In our study, we identified CCR1, which is enriched in monocytes and macrophages, as a potential therapeutic target for two diseases. This selection was based on the abundant expression of CCR1 in these two cell types and its potential key role in disease progression. To find potential therapeutic drugs targeting CCR1, we employed Autodock vina software for virtual screening. The aim was to find compounds that exhibit high affinity with CCR1. The 7VL9.pdb file was downloaded from the PDB database and its three-dimensional structure was visualized using PyMol software (Fig. 9A). In the crystal structure of CCR1, we found a cholesterol molecule bound at a pocket site (Fig. 9B). This cholesterol at the pocket site was set as the docking site and a grid file was established in Autodock vina software. Subsequently, we conducted a virtual screening of 323 natural product small molecules. The affinity and root mean square deviation (rmsd) values for each compound were obtained after screening, which can assist in evaluating the binding strength and stability of the compound with CCR1. Dioscin, Camptothecin, and Albamycin emerged as the top three compounds with the highest affinity. The binding poses of these three compounds with CCR1 were visualized using PyMol software, aiding in understanding how these compounds bind to CCR1 (Fig. 9C).
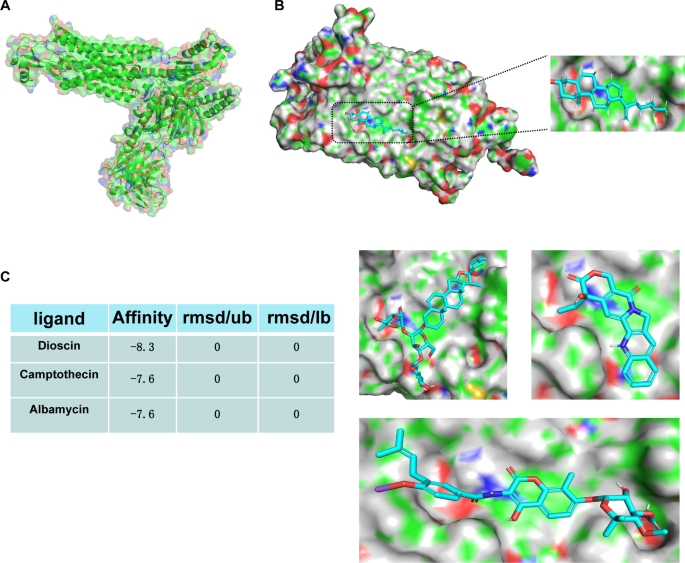
Virtual screening of potential therapeutic compounds targeting CCR1. (A) The three-dimensional structure of CCR1 visualized using PyMol software. (B) Cholesterol molecule bound at the pocket site in the CCR1 crystal structure. (C) Binding poses of Dioscin, Camptothecin, and Albamycin with CCR1, visualized using PyMol software.
