3D body posture reconstruction
To accurately track the eyes of freely swimming fish in 3D, our initial step involves reconstructing the body posture of the fish in 3D. We applied DeepShapeKit24, the process is summarized in Fig. 1. We begin by 3D scanning the fish to create a benchmark 3D model. Next, we optimize the position and kinematics of this model to minimize the discrepancies between the model and the silhouettes of real fish tracked by Mask-RCNN as well as key points of the body central line tracked by DeepLabCut. An LSTM (long short-term memory network)-based27 smoother is applied to smooth the 3D mashes in sequence. With the 3D body mesh over the global coordinate, we get fish body posture in 3D.
3D eye tracking
We mainly involve two main steps to track the continuous movements of fish eyes in 3D: perspective transformation and eye detection (Fig. 1). Since fish swim in 3D, exhibiting motions characterized by rolls, yaws and pitches, their eyes cannot be consistently captured in a perpendicular view by a fixed camera, making perspective transformation necessary. To address this issue, we employ a network called Mask-RCNN28 to isolate how each fish appears in each view and utilize a perspective transformation to convert the 2D cropped image into a 3D representation based on the orientation of the fish’s meshed body:
$${C}_{x,y}=H\times {I}_{x,y}$$
(1)
Where, H is the transformation matrix; Ix,y represents the original image, where the fish’s body is tilted in 3D space and projected on the 2D image; Cx,y is the pixel coordinate on the transformed image. The transformation matrix H (3 × 3) is calculated based on the correspondence between the fish’s 3D pose and the target pose (fish body parallel to the image plane), as shown in detail in the method section and supplementary materials. We then applied the Mask-RCNN again to detect the eye sclera (large light disk) with only 50 hand-labelled images for training. We then applied threshold-based blob detection for the pupil (small dark disk) on the transformed image. The eye sclera and pupil positions are then transformed back to the original perspective in 3D as the position of the eye of real fish in 3D (see methods).
Reconstruction of retinal view
We applied Blender29, an open-source 3D modeling and animation software, to reconstruct the group swimming dynamics of fish in a tank and to estimate the retina view from the perspective of a following fish’s eye using virtual cameras (Fig. 2).

First step (yellow): position a camera at the tracked eye position in 3D. Second step (green): rotate the camera to align with the fish’s view direction. Final step (pink): configure the camera parameters based on the structure of the fish’s eye.
The fish models are based on the 3D mesh body tracked with both kinematics and movements for each fish (Fig. 2). We then place each fish model with corresponding kinematics at the corresponded positions in 3D for each frame (as described in the method section). Subsequently, we set a virtual camera which is controlled by the eye movement (in both position and rotation) and estimate the retina view from the fish’s eye (see method for details). We set the virtual camera’s field of view to 190 degrees, mimicking that of a goldfish’s eye30, resulting in a 50° blind spot behind with eyes.
3D eye tracking verification
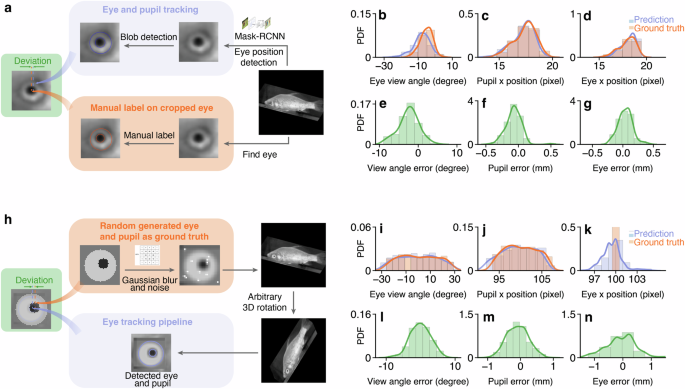
We evaluated our eye-tracking method using two approaches: using manually labeled data after the perspective transformation, and using synthesized side-view images with randomly initialized pupil sizes and positions on the sclera. The human-labeled data and synthesized images served as ground truth after and before perspective transformation, respectively.
Labeled fish eye images
We sampled 110 fish images from the videos and transformed them according to the fish’s pose. We then marked the centers and sizes of the sclera and pupil on the fish images using circular markers. After that, we compared the detected positions and sizes of the pupil and sclera with the manually labeled ones (Fig. 3). As shown in Supplementary Tab. 2, we observed a view angle error distribution with a mean of −2.445 degrees and a standard deviation of 2.650 degrees, within a range of 0 ± 9 degrees. The error in pupil position lies within 0 ± 0.5 mm, with a mean of −0.072 mm and a standard deviation of 0.120 mm. For the sclera position, the error lies within 0 ± 0.5 mm, with a mean of −0.041 mm and a standard deviation of 0.116 mm.

a The pipeline of manually labeling eye positions after perspective transformation and conducting eye tracking as a comparison. Probability distribution function (PDF) of b–d: ground truth and detected eye view angle, pupil position, and eye position. e–g: deviations between the ground truth and eye detection outputs. h The pipeline of generating synthesized data as ground truth and conducting eye tracking for a comparison. The PDF of i–k ground truth and detected eye view angle, pupil position, and eye position (k). l–n deviations between the ground truth and eye detection outputs. The deviations are scaled based on the average eye diameter (6.75 mm).
Synthesized fish eye image
To validate our eye-tracking method before perspective transformation, we synthesized side-view images with generated ground truth for eye position. First, we filled a square with dimensions w × w using the average color value from the area surrounding the fish’s eye in the original side-view image. At the center of this square, a light circle, representing the eye sclera, is drawn with a diameter of \(\frac{2w}{3}\). For the artificial pupil, a dark circle is placed within the light circle. The size and position of this pupil are randomly determined, adhering to a uniform distribution. The radius varies within a range of \([\frac{w}{6}-\frac{w}{20},\frac{w}{6}+\frac{w}{20}]\) pixels, while its position is defined to be within \([\frac{w}{2}-\frac{w}{6},\frac{w}{2}+\frac{w}{6}]\) pixels. We chose this range to ensure that the distance between the pupil and sclera borders is minimal, replicating the appearance of the eye when the fish turns its head toward the camera. Next, we perform a perspective transformation to tilt the images, introducing a distortion that aligns with the fish’s body as captured in the camera’s view. Finally, we apply a Gaussian blur to the eye with a kernel size of \(\frac{w}{6}\), add white dot noise at random locations amounting to 0.05% of the total pixel count, and place the synthesized eye image onto the fish’s eye location in the video, as illustrated in Fig. 3h.
We subsequently applied our eye-tracking algorithm to track the eye movements of fish within this synthesized dataset. Results with 500 synthesized images are shown in Fig. 3 and Supplementary Tab. 2. In general, we observe an view angle error within 0 ± 10 degrees, with a mean of −0.099 degrees and a standard deviation of 2.950 degrees. For the pupil position, the error lies within 0 ± 1 mm, with an average error of −0.090 mm and a standard deviation of 0.326 mm. For the eye sclera position, the error lies within 0 ± 2.5 mm, with an average error of −0.016 mm and a standard deviation of 0.628 mm.
Tracking quality across different view angles
Since our tracking method uses blob detection for the pupil position, potential issues may arise when the fish’s pupil is too close to the edge of the sclera. To assess whether the position of the pupil affects our tracking quality, we analysed the tracking quality across the different positions of pupil. We split the data into two groups: center cases, where the pupil is centrally positioned, and edge cases, where the pupil is positioned near the edges (see Supplementary Fig. 6). Results are summrized in Supplementary Tab. 4. For manually labeled data, the mean view angles were −2.42∘ for the edge cases and −2.47∘ for the center cases, with standard deviations of 3.02∘ and 2.23∘, respectively. For synthesized data, the mean view angles were −0.43∘ for the edge cases and 0.31∘ for the center cases, with standard deviations of 3.16∘ and 2.70∘, respectively.
Eye movement and retinal view reconstruction in schooling behavior
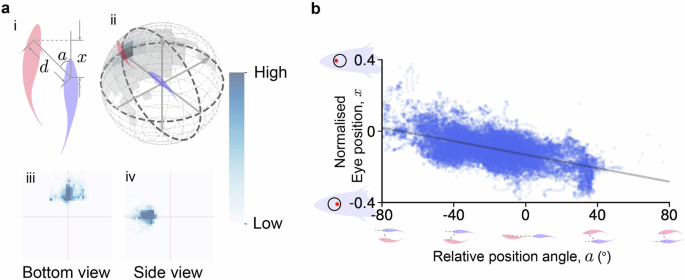
To further assess our eye movement tracking and retinal view reconstruction, we applied the algorithms to two fish swimming in a flow tank with two perpendicular views, and then compared the retinal view and eye movement with their schooling behavior. We first applied the following filters to extract leader-follower schooling behavior by: the position angle, defined from the leader’s position to the follower’s local coordinate, is less than 40 degrees (∣a∣ < 40∘); the front-back distance is less than 0.4 meters (∣x∣ < 0.4); and the distance between the two fish is less than 0.45 meters (d < 0.45 meters). As a result, we obtained a dataset comprising 45,499 data points, divided into 7860 cases where the leader was in the front-right position relative to the follower (a > 0), and 37,639 cases where the leader was in the front-left position (a < 0) (see Fig. 4a). Over the leader-follower schooling behavior, the front fish mostly appears within 100∘ in front.

a Selected pairs of goldfish within swimming groups. (i) Two-fish relationship from the bottom view. (ii) Front fish position density map on a 3D sphere. All 45,499 pairs of data are binned in 12 degrees increments, with a radius of 17.5 cm. (iii): The front fish position heat map, viewed from the bottom side, shows the relative positions of the front fish from the perspective of the following fish looking upwards. Each point on the heat map represents the position of the front fish, with the following fish’s position fixed at the center. The x and y axes span a range of ±50 cm, capturing the spatial distribution of the front fish. (iv): The front fish position heat map, viewed from the front side, presents the relative positions of the front fish from the perspective of the following fish facing left. Again, each point represents the front fish’s position, with the following fish at the center. The x and y axes cover a range of ±50 cm, illustrating the positioning patterns during the interaction. b The correlation between the normalised eye movements ranging from −0.4 (rightmost position) to 0.4 (leftmost position) and relative position angles.
We then applied our eye movement tracking to the follower and analyzed the correlation between eye movements and the relative position angle a between the two fish, as shown in Fig. 4b. The eye position was normalized based on the sclera, so that we could compare the amount of eye movement between fish with different eye sizes. We observed that the relative position angle a is positive when the leading fish is on the left side of the following fish’s head direction (as illustrated in Fig. 4b), and negative when the leading fish is on the right side (the correlation between x and a is r = −0.69). This means that when a fish sees another in front, the position angle between them causes the eye on the same side as the neighbor to move more forward, while the opposite eye may move backward. These eye movements during leader-follower behavior are consistent with previous studies31,32, indirectly suggesting the effectiveness of our algorithm. Additionally, since there is an asymmetry in data amount between the leader on the left and right of the follower is primarily due to the asymmetric boundaries of the flow tank, we also conducted bootstrap with same analyses. These analysis results show similar correlation with an average slope of −0.00195 and an average intercept of −0.132, with standard deviations of 3.46 × 10⁻⁵ and 6.85 × 10⁻⁴, respectively (see Supplementary Fig. 7)
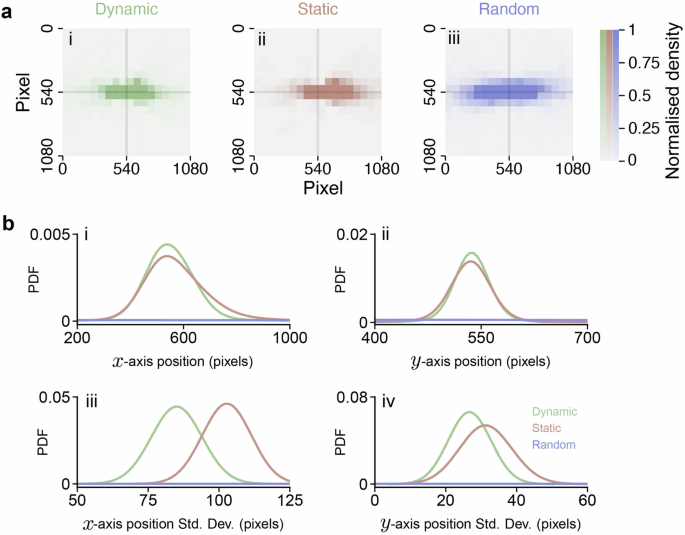
Finally, we applied retinal view reconstruction to estimate how the leader appeared from the follower’s perspective during the following behavior. For comparison, we reconstructed the retinal views under conditions where the eyes were either stationary or moved randomly (as shown in Fig. 5a). In these control conditions, the leader’s position on the follower’s retina varied much more significantly (as illustrated in Fig. 5b) compared to when the eyes were moving intentionally, as observed in our experiments (refer to Supplementary Tab. 1). This suggests that fish deliberately adjust their eye movements to maintain their neighbor, in this case, the leader, near the center of their retina. This behavior is also consistent with previous reports33,34,35, indirectly verifying our method.

a follower’s retinal view of the front individual with tracked eye movements (i), static eye (ii), and randomly moved eye (iii). b position of the front individual on the follower’s retina along the x-axis (i) and y-axis (ii), and their corresponding variances (iii and iv) as determined by bootstrap analysis.
