Dataset
We benchmarked performance on two commonly used datasets: Davis [32] and KIBA [33]. Additionally, we expanded our investigation by model downstream studies on four datasets, including BindingDB [34] and Metz [35], in addition to the aforementioned datasets. Furthermore, we conducted a case study on the DrugBank [36]. Detailed information regarding each task will be presented in their respective sections. The detailed information of Davis and KIBA utilized in the regression tasks is as follows:
-
The Davis dataset, created by Davis et al. comprises 68 compounds along with their binding affinity data for 442 protein targets. Each compound has experimentally determined dissociation constant \((K_d)\) values with their respective targets. This value reflects the strength of binding between the drug molecule and the target protein. The \(K_d\) values obtained in the experiment are transformed as follow:
$$\begin{aligned} pK_d=-\log _{10}(K_d/10^9)\end{aligned}$$
(21)
-
Tang et al. introduced a model-based integration approach called KIBA to generate an integrated drug–target bioactivity matrix. The KIBA dataset comprises approximately 2111 compounds along with binding affinity data for 229 targets. It uses the KIBA score to represent the interaction between the drug and the target protein.
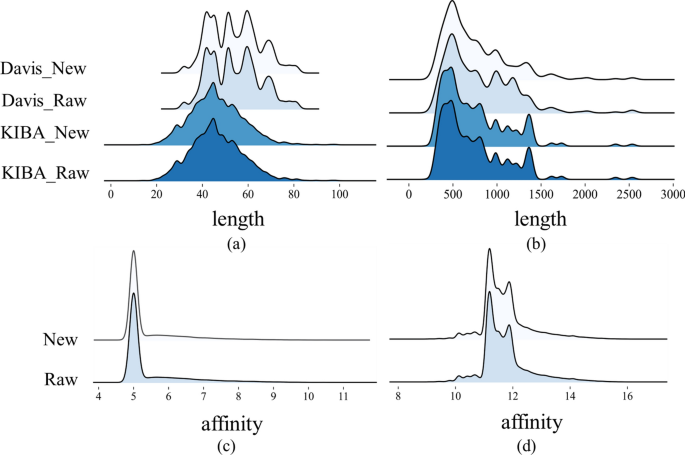
We discovered that the datasets suffer from data duplication problems, wherein identical drug–target pairs are associated with different affinity scores. It may affect the training process, thereby reducing the predictive performance of the model. Table 1 shows the statistical information of the two datasets.
Redundancy represents the quantity of duplicated drug–target pairs within the dataset, and the \(Redundancy\ rate\) is computed as follow:
$$\begin{aligned} Redundancy\ rate=\frac{Redundancy}{N} \end{aligned}$$
(22)
where N represents the total number of drug–target pairs of the dataset.
This study implemented distinct preprocessing strategies for the two datasets based on the proportion of duplicated drug–target pairs within the entire dataset. As for Davis, we averaged the affinity scores of all duplicate drug–target pairs to obtain the final value used in training. For the KIBA dataset, we removed all duplicate pairs. The Davis dataset exhibits a high redundancy rate of 18.3\(\%\), thus implementing a deduplication measure would impact the overall distribution of the dataset. As shown in Fig. 4, our operations do not change the overall distribution of the datasets.

Comparison of data distribution before and after processing the Davis and KIBA dataset. a Distribution of SMILES sequence length. b Distribution of amino acid sequence length. c Distribution of affinity score for Davis dataset. (d) Distribution of affinity score for KIBA dataset
Randomly splitting datasets (where drugs and targets in the test set have already appeared in the training set) may cause information leakage and make the results overly optimistic [37]. From an application perspective, most proteins or drugs do not appear in the training [38]. In this study, we followed the given methodology to divide the dataset, which was implemented by the open-source software DeepPurpose [39]:
-
Novel-protein: There is no overlap between the proteins in the test set and those in the training set. Additionally, all drugs will be present in both sets.
-
Novel-drug: The drugs used in the test set do not overlap with those used in the training set, whereas all proteins are present in both the test and training sets.
-
Novel-pair: There is no intersection between drugs and proteins in either the test or training sets.
Each of the three data partitioning methods above addresses different research objectives. The model trained using the Novel-protein partitioning approach facilitates drug discovery for novel proteins. Models trained using the Novel-drug partitioning method are useful for identifying interacting proteins for newly developed drug compounds. The Novel-pair approach provides valuable information on the binding of novel proteins to newly developed drugs.
Performance evaluation metrics
To evaluate the performance of various models, our study employed regression evaluation metrics MSE loss, and the Concordance Index (CI) [40]. CI is defined as the proportion of label pairs for which the predicted outcome is consistent with the actual outcome. The formula for CI is as follows:
$$\begin{aligned} CI=\frac{1}{Z}\sum \limits _{d_i>d_j}h(b_i-b_j)\end{aligned}$$
(23)
$$\begin{aligned} h(x)={\left\{ \begin{array}{ll} & 1, \ \ \ \text { if } x>0 \\ & 0.5, \text { if } x=0 \\ & 0, \ \ \ \text { if } x<0 \end{array}\right. } \end{aligned}$$
(24)
where \(d_i\) and \(d_j\) are distinct true label values, with \(d_i>d_j\), and \(b_i\) and \(b_j\) are the corresponding predicted values. If the relative ordering of two predicted values matches that of the true values, the indicator function h(x) returns a value of 1. It returns 0.5 or 0 if they are equal or opposite. In Eq. (23), Z represents the number of ordered pairs of affinity label values in the dataset. CI value ranges from 0 to 1. A CI of 1 indicates that all ordering of affinity scores is correctly predicted, whereas a CI of 0 signifies that all ordering is incorrectly predicted. Higher CI values imply stronger predictive capability.
Settings of hyperparameters and experimental environment
All experiments in this study were conducted on four NVIDIA RTX A6000 (48G) GPUs. The implementation was carried out using Python version 3.8.0 (default, Nov 6, 2019, 21:49:08) and PyTorch [41] version 2.0.1, with training facilitated by the Adam optimizer [42]. Additionally, we employed the Cosine Annealing scheduler (CosineLRScheduler) encapsulated in the timm library, with parameter configurations detailed in Table 2. Batch sizes for each dataset were determined within the range: [32, 64, 128, 256], with a batch size of 64 set for the Davis dataset and 128 for the KIBA dataset. The training epochs were set to 3000, with early stopping applied at 500 epochs.
Performance comparison with baseline methods
Baseline methods
This section presents a comparative analysis of the experimental results between MTAF–DTA and baseline methods on benchmark datasets Davis and KIBA. To validate the effectiveness of the proposed MTAF–DTA model, we compared it against the following baseline methods: Support Vector Machine (SVM), Random Forest (RF); DeepDTA [3]; TransformerCPI [19]; MGraphDTA [43]; ColdDTA [31]; AttentionMGT-DTA [44].
However, as shown in Table 3, these methods insufficiently extract and fuse drug features, leading to drug information loss, which negatively impacts model prediction outcomes. Furthermore, approaches relying on linear concatenation for drug–target integration lack a simulation of the fusion process between them. In response to these limitations, MTAF–DTA incorporates enhanced drug representation fusion and employs a multi-type attention mechanism for drug–target integration, effectively mitigating some of these issues. In comparison with the method that leverages AlphaFold2 for protein information extraction, MTAF–DTA still demonstrates superior competitiveness. Under the cold-start partitioning of the Davis dataset, our CI and MSE metrics consistently surpass that of AttentionMGT-DTA. Specifically, we expanded the types of drug features to include molecular graph information, Morgan fingerprints, and Avalon fingerprints, thereby extracting a richer set of chemical semantic information compared to existing methods. Furthermore, we employed an attention-based fusion module to map the various modalities of drug features into a uniform representation space, resulting in the final drug representation. This operation assigns different attention weights to the diverse modal features, maximizing the exploitation of their respective contributions.
Performance comparison
The superior performance of MTAF–DTA underscores its effectiveness in the task of DTA prediction. We employed a five-fold cross-validation method, in which all data were evenly partitioned into five parts, with one part used as the test set and the remaining four parts used for training. The results for each evaluation metric were derived as the average of five cross-validation iterations. To ensure fairness, we trained baseline models using the optimal parameter settings determined by the baseline method or directly utilized results reported in their published papers. This approach was adopted to mitigate potential errors that may arise during the experimental execution. However, differences in dataset partitioning randomness and variations in experimental machine performance may lead to discrepancies between our experimental outcomes and those reported in other studies.
Supplementary Table 1, Additional file 1 illustrates the comparison between different baseline methods and MTAF–DTA on the Davis dataset. The results indicate that MTAF–DTA achieves the best prediction performance in terms of the CI metric across three distinct data partitioning schemes: Novel-drug, Novel-protein, and Novel-pair. Specifically, under the Novel-protein partitioning scheme, MTAF–DTA outperforms the SOTA method by 1.1% in CI and reduces the MSE by 9.2%, yielding values of 0.840 and 0.330, respectively. These results signify that our designed drug feature extraction and fusion modules bolster the representation capability of drug features, effectively enhancing the predictive capacity for the affinity between known drugs and novel protein targets.
On the KIBA dataset, as shown in Supplementary Table 2, Additional file 1, we compared MTAF–DTA with SVM, RF, DeepDTA, TransformerCPI, and MGraphDTA. Traditional machine learning method random forest achieved the best performance on the Novel-drug partitioning, with CI and MSE reaching 0.785 and 0.348, respectively, indicating that machine learning methods still possess competitive capability in DTA prediction tasks [45]. Under this partitioning scheme, MTAF–DTA demonstrated improvements compared to other methods. Specifically, it outperformed SVM by 5.4%, DeepDTA by 6.4%, TransformerCPI by 7.9%, and MGraphDTA by 1.6% in terms of CI. Notably, our proposed method continued to achieve the best performance on the Novel-protein partitioning. Here, the CI reached 0.769, surpassing the values of other methods: SVM (0.596), RF (0.647), DeepDTA (0.728), TransformerCPI (0.627), and MGraphDTA (0.708), with respective improvements of 17.3%, 12.2%, 4.1%, 14.2%, and 6.1% in CI.
To visualize the performance improvement of MTAF–DTA, we plotted the CI and MSE from Supplementary Table 1, Additional file 1 and Supplementary Table 2, Additional file 1, as shown in Fig. 5. It is evident that our method exhibits significant advantages. MTAF–DTA has achieved notable performance improvement on the Novel-protein partitioning, attributed to the extraction and integration of richer drug features. Additionally, the SAB part further enhanced the prediction performance of the model.

Visual comparison of our results on two datasets. a, b On Davis. c, d On KIBA
Performance of the model on downstream tasks
The insufficient simulation of the drug–target binding process is indeed a challenge faced by current AI methods, and this is one of the primary motivations for our research. Given the extensive exploration of drug features in our method and the demonstrated potential of our research in identifying potentially effective drugs for novel proteins in the regression tasks, this section primarily focuses on experimental validation under the Novel-protein partitioning scheme.
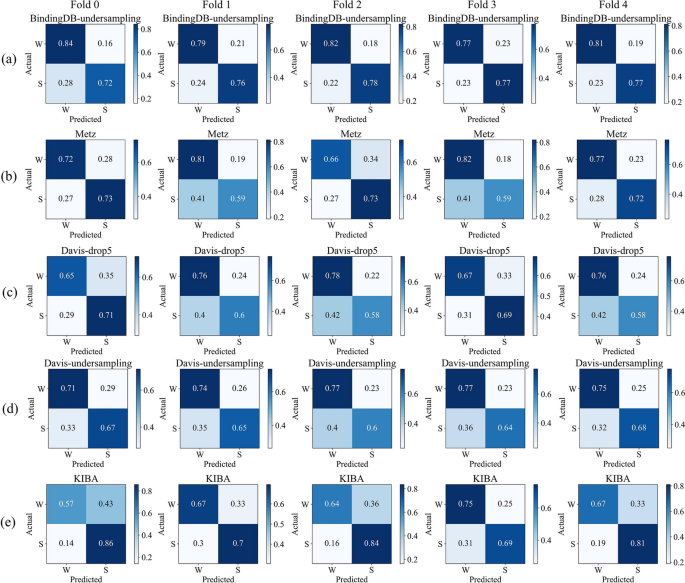
We conducted our study on the BindingDB, Metz, Davis, and KIBA datasets. Considering the different distributions of affinity values in each dataset, we applied different thresholds to classify them into strong and weak bindings. To balance the datasets, we undersampled 16,699 entries from the BindingDB dataset. For the Davis dataset, we either undersampled 1037 drug–target pairs with affinity values of 5 or completely removed them. The statistics of each dataset are presented in Table 4.
We visualized the normalized confusion matrices obtained after MTAF–DTA’s prediction. Figure 6 presents the results of BindingDB-undersampling, Metz, Davis-drop5, Davis-undersampling, and KIBA under five-fold cross-validation. It is evident that the majority of molecules can be accurately predicted across all datasets. And our approach demonstrates a relatively low probability of predicting false positives. For the undersampled BindingDB dataset, our method achieved an average false positive rate of 19.4\(\%\) under five-fold cross-validation, whereas Metz reported 24.4\(\%\) and KIBA 34\(\%\). The balanced Davis dataset, which excluded affinity values of 5, exhibited a false positive rate of 27.6\(\%\), while the undersampled dataset showed a false positive rate of 25.2\(\%\). In conclusion, MTAF–DTA performs well in predicting DTA for potential drugs targeting novel proteins.

Normalized confusion matrix visualization under five-fold cross-validation (W: “Weak Binding”; S: “Strong Binding”). a BindingDB-undersampling. b Metz. c Davis-drop5. d Davis-undersampling. e KIBA
Comparison and analysis of data processing
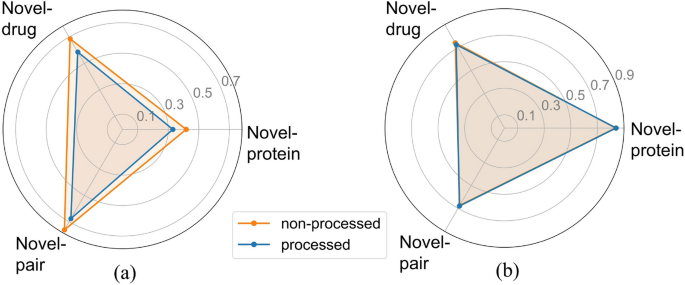
Our experiments, like most studies, were conducted on public datasets. However, unlike previous approaches, we addressed the problem of the dataset containing different affinity scores for the same drug–target pairs. To justify this procedure, we conducted a comparative experiment between the processed and unprocessed datasets. All other hyperparameters and experimental conditions remained consistent throughout the study.
Figure 7a illustrates a significant optimization in MSE following data processing, affirming that the presence of diverse affinity scores indeed influences the model training process, potentially diminishing the predictive capability of the model. The CI metric results in Fig. 7b further validate this observation, showing enhancements in two partitioning schemes for the processed dataset (Novel-protein: 0.840, Novel-drug: 0.726, Novel-pair: 0.679) compared to the unprocessed data (Novel-protein: 0.836, Novel-drug: 0.741, Novel-pair: 0.673). Based on the comprehensive experimental results, we ultimately retained the data preprocessing step. It is noteworthy that the results obtained from training on the raw data still exhibit advantages in comparison to baseline methods, demonstrating the superiority of MTAF–DTA in DTA prediction tasks.

The comparison of metrics before and after data processing. a MSE results. b CI results
Ablation study
To validate the effectiveness of the components proposed in our method, we conducted the following ablation experiments on the Davis dataset. Specifically, we examined the impact of drug–target fusion methods, drug feature fusion methods, and the quantity and types of drug features on the DTA prediction task. The procedures are as follows:
-
\(AMG-L_{dp}SAB\): Replacing the multi-modal fusion of drug and protein features with a simple linear operation.
-
\(L_{AMG}-SAB\): Replacing the complex fusion method in our approach with a simple linear summation of drug features.
-
\(MG-SAB\): Reducing the fusion of drug features from molecular graph features, Morgan fingerprint, and Avalon fingerprint to a fusion of molecular graph features and Morgan fingerprint, employing the same fusion method as the full MTAF–DTA model which was denoted as baseline.
The experimental results, as depicted in Supplementary Table 3, Additional file 1, demonstrate the effectiveness of the aforementioned modules in the DTA prediction task. Under the Novel-drug partitioning scheme, selecting only Morgan fingerprint and molecular graph features as drug features resulted in a 1.5% decrease in CI. This result validates the effectiveness of our approach in selecting drug features for the DTA prediction task. Within the Novel-protein partitioning scheme, the \(AMG-L_{dp}SAB\) operation led to a 1.3% decrease in the CI metric. In the \(L_{AMG}-SAB\) ablation experiment, only the MSE metric showed a 0.5% improvement under the Novel-pair partitioning scheme, whereas the CI metric decreased by 1.8%, indicating the crucial importance of both drug feature fusion and drug–target feature fusion across the entire DTA prediction task.
Case study
In this section, we present case studies focusing on specific drugs and proteins. We randomly selected two proteins from DrugBank and a subset of drugs associated with each protein, as well as two drugs and a subset of proteins associated with each drug, to constitute our test set.
As shown in Tables 5 and 6, MTAF–DTA achieved a prediction accuracy of 100% for proteins related to Moxisylyte, and the prediction accuracy for Lindane reached 90%. For the proteins lg gamma-1 chain C region and Microtubule-associated protein tau (MAPT), we achieved prediction accuracies of 90% and 80%, respectively. These experimental results effectively demonstrate the capability of MTAF–DTA to screen relevant drugs for specific target proteins and also validate its superior ability in DTA prediction tasks.
